Loading
Archive
Tag: Power BI

6 Ways to Monitize Your Power BI Skills (That actually works)
Most Power BI Developers Are Broke. Here’s Why (And How to Fix It) You spent three months learning Power BI. You built 15 dashboards, earned your certification, and posted your portfolio on LinkedIn with that generic “Open to opportunities” caption. Then you waited. And waited—nothing but crickets. . Meanwhile, someone with half your technical skills just closed a ₦500,000 project… Read more

Learn How to Scrape Website with Power Query
Web scraping is the process of extracting data from websites through automated means, rather than manual copy and pasting. This can be achieved using several tools, with Python being a popular choice. . The choice of web scraping tool can be influenced by the amount of data needing extraction. For large-scale scraping needs, Python libraries like BeautifulSoup and Selenium may.. Read more
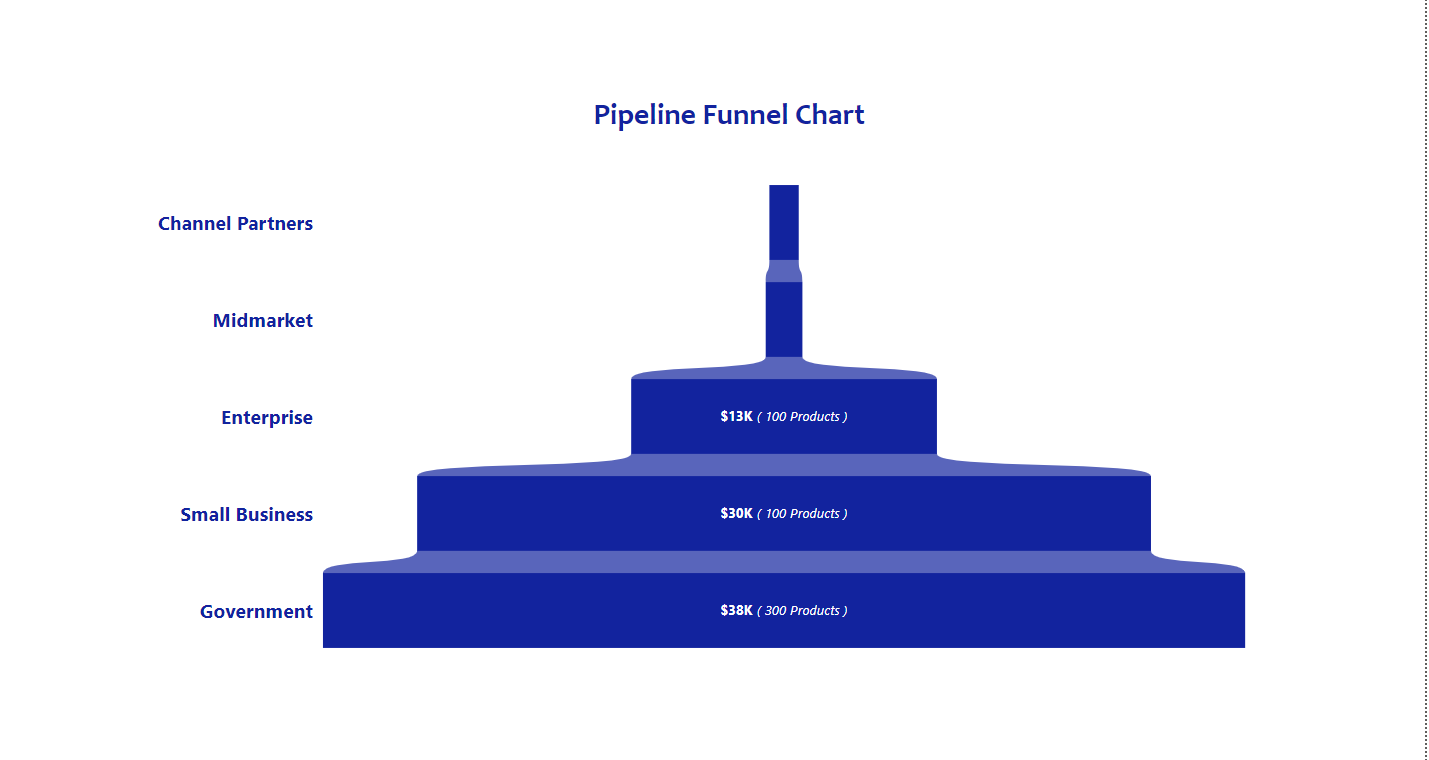
How to create a Pipeline Funnel Chart with Visual Calculation in Power BI
A Pipeline funnel chart demonstrates data flow through a linear, sequential process within a sales pipeline. They help readers quickly make sense of data and are often used by organizations to identify potential problems within a process. They also help organizations take quantified measurements of conversion, churn, and sales rates. – MindManagers . Funnel charts are usually seen in business.. Read more

Tools Needed as a Data Analyst
Data analytic tool is a term used to describe software and applications that data analysts use in order to develop and perform analytical processes. Their aim is to help companies make better, informed business decisions while decreasing costs and increasing profits. Data analysis, moreover, is a core practice of modern businesses. Choosing the right data analytic tool as a beginner.. Read more