Loading
Homepage
  • Data

HR Atrrition Dashboard

Problem Overview

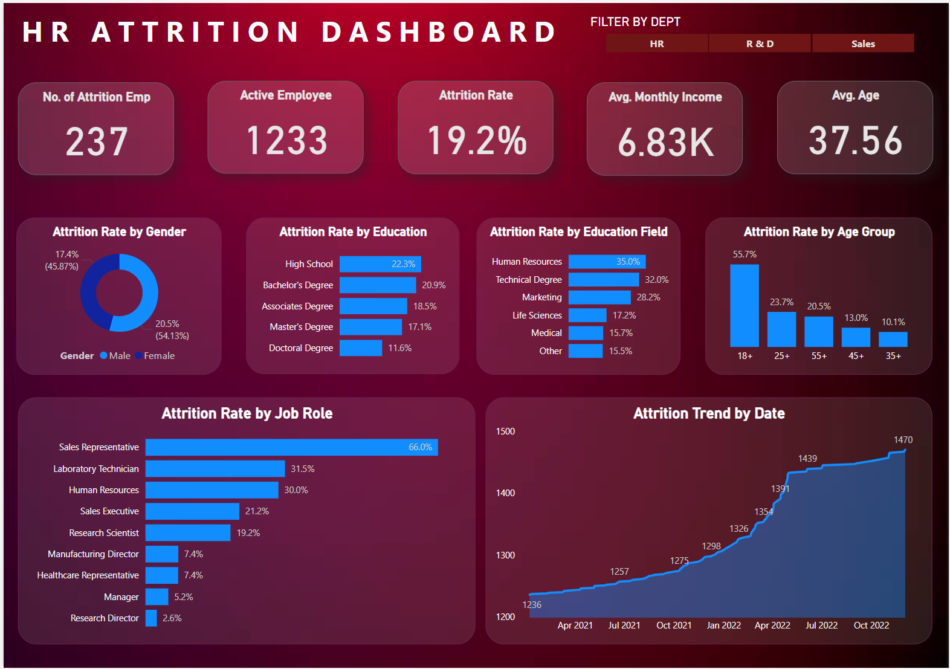
An organization has been experiencing high employee turnover and wants to analyze the factors contributing to attrition. The company aims to reduce attrition by understanding the underlying causes and implementing targeted retention strategies. The organization aims to understand and reduce employee attrition to improve retention and overall employee satisfaction. The key questions to address include:

  • What is the current attrition rate, and how does it vary by department?

  • How do attrition rates differ by gender, education, education field, age group, and job role?

  • What are the trends in employee attrition over time?

  • What are the average monthly income and age of employees, and how do they relate to attrition?

To analyze the provided employee attrition data and create a comprehensive dashboard that visualizes key metrics, helping the organization understand attrition patterns and make data-driven decisions to improve retention.

Steps

  1. Data Collection and Preparation:

    • The dataset was collected, which included information on employee attrition, active employees, demographics, job roles, and income.

    • Data cleaning and transformation were performed to ensure accuracy and consistency, handling missing values and inconsistencies.

  2. Data Analysis:

    • Key metrics were calculated, such as the attrition rate, average monthly income, and average age.

    • Advanced calculations were performed to analyze attrition rates by gender, education, education field, age group, and job role.

    • Attrition trends over time were analyzed to identify patterns and potential causes of employee turnover.

  3. Visualization:

    • A dashboard was created to visualize the data effectively. It included various charts and graphs, such as bar charts for attrition rates by different categories, line charts for attrition trends over time, and metrics displayed prominently for quick reference.

    • The dashboard also included filters to allow users to view data by department, such as HR, R&D, and Sales.

  4. Insights and Reporting:

    • The dashboard provided insights into employee attrition, such as identifying job roles with high attrition rates and understanding demographic factors contributing to turnover.

    • It highlighted areas for improvement, such as departments with high attrition rates and trends over time that may indicate underlying issues.

Outcome

The analysis and dashboard provided the organization with a clear understanding of employee attrition patterns, enabling it to make informed decisions to improve retention. The visualizations highlighted key trends and areas for improvement, helping the organization to focus on high-risk departments and job roles and to implement targeted retention strategies.

Similar projects

Want to see how your business is performing? I'm here to help

© Mubar Dauda 2024. All rights reserved.

Developed by: Mubar BI

+
+