Loading
Homepage
  • Data

Employee Analytical Dashboard

Problem Overview

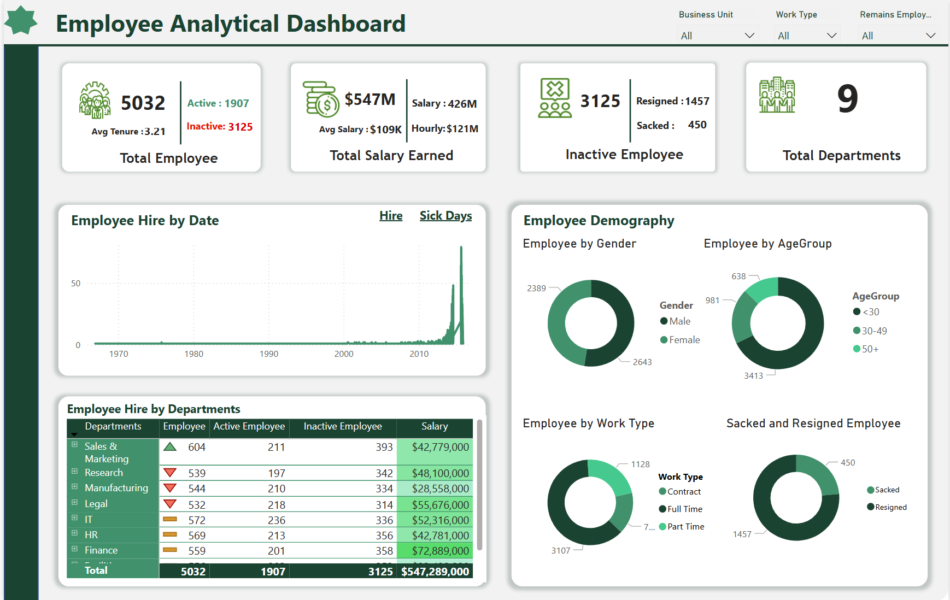
An organization has accumulated extensive employee data over the years. The company wants to analyze this data to gain insights into workforce dynamics, employee retention, and overall performance. The organization aims to understand its workforce dynamics to make informed decisions regarding employee management, retention, and recruitment. The key questions to address include:

  • What is the average tenure and salary of employees?
  • How are employees distributed across different departments and work types?
  • What are the trends in employee hires over the years?
  • What are the reasons for employee inactivity, and how can they be mitigated?
  • How does the employee demographic breakdown look in terms of gender and age groups?

To analyze the provided employee data and create a comprehensive dashboard that visualizes key metrics, helping the organization understand its workforce and make data-driven decisions.

Steps

Data Collection and Preparation:

  • The dataset was collected, which included information on employee tenure, salary, work type, department, demographics, and employment status.
  • Data cleaning and transformation were performed to ensure accuracy and consistency, handling missing values and inconsistencies.

Data Analysis:

  • Key metrics were calculated, such as average tenure, average salary, total salary earned, and the distribution of employees across departments and work types.
  • Advanced calculations were performed to analyze employee demographics, including gender and age group distributions.
  • Employee inactivity was analyzed by categorizing reasons for inactivity, such as resignations and terminations.

Visualization:

  • A dashboard was created to visualize the data effectively. It included various charts and graphs, such as bar charts for employee distribution by department and work type, line charts for employee hires over the years, and pie charts for gender and age group distributions. The dashboard also included metrics and KPIs displayed prominently for quick reference.

Insights and Reporting:

  • The dashboard provided insights into employee trends, such as hiring patterns over the decades, average tenure, and salary distributions.
  • It highlighted areas for improvement, such as departments with high inactivity rates and trends in employee resignations and terminations.

Outcome

The analysis and dashboard provided the organization with a clear understanding of its workforce dynamics, enabling it to make informed decisions regarding employee management, retention, and recruitment. The visualizations highlighted key trends and areas for improvement, helping the organization to focus on high-performing departments and to address issues related to employee inactivity and turnover.

Similar projects

Want to see how your business is performing? I'm here to help

© Mubar Dauda 2024. All rights reserved.

Developed by: Mubar BI

+
+