Loading
Archive
Tips & Tricks
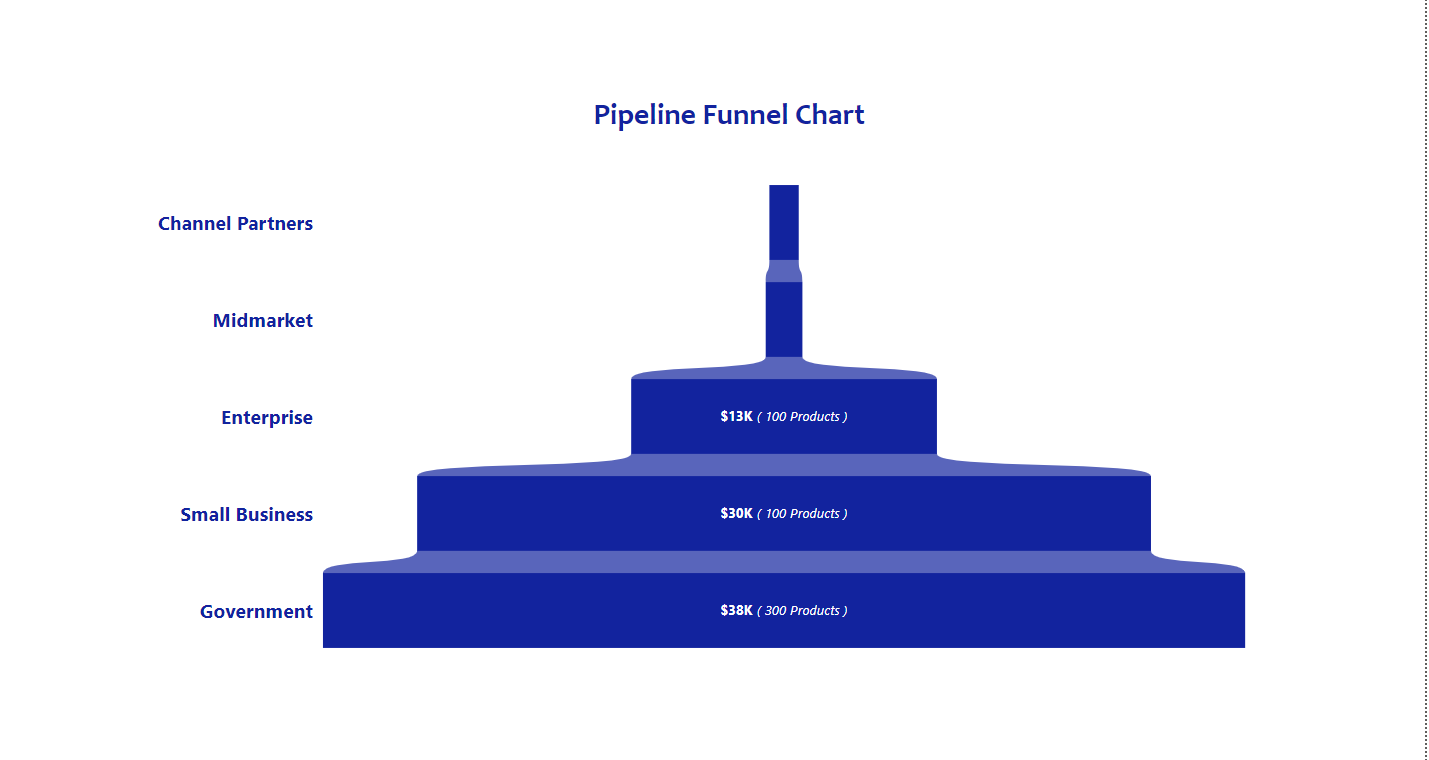
How to create a Pipeline Funnel Chart with Visual Calculation in Power BI
A Pipeline funnel chart demonstrates data flow through a linear, sequential process within a sales pipeline. They help readers quickly make sense of data and are often used by organizations to identify potential problems within a process. They also help organizations take quantified measurements of conversion, churn, and sales rates. – MindManagers . Funnel charts are usually seen in business.. Read more

How to create an engaging content?
Communication is easy in theory, but what makes it challenging is ensuring that your message—whether in writing, video, or audio—is clearly understood and resonates with your audience.