Loading
Archive
Day: July 24, 2024
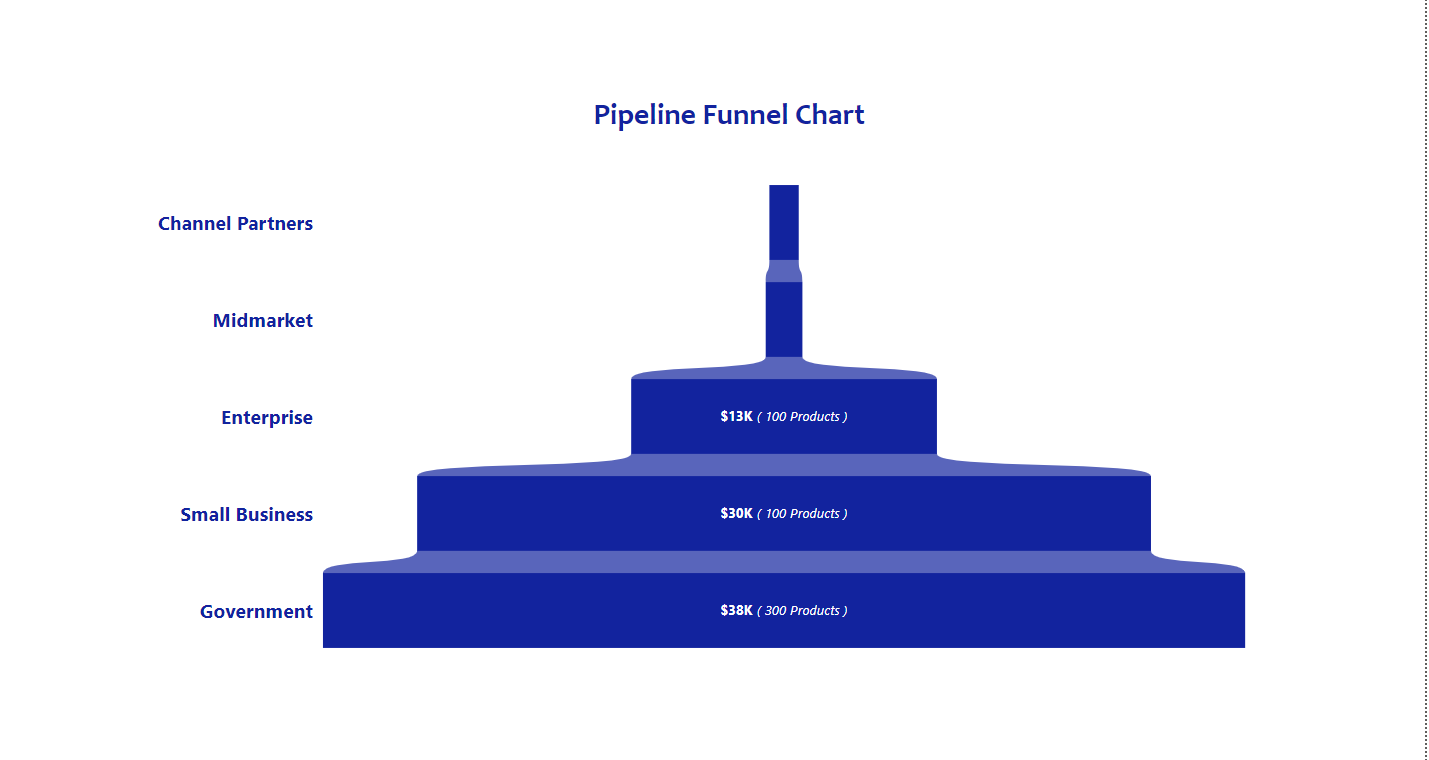
How to create a Pipeline Funnel Chart with Visual Calculation in Power BI
A Pipeline funnel chart demonstrates data flow through a linear, sequential process within a sales pipeline. They help readers quickly make sense of data and are often used by organizations to identify potential problems within a process. They also help organizations take quantified measurements of conversion, churn, and sales rates. – MindManagers . Funnel charts are usually seen in business.. Read more