Loading
Archive
Month: July 2024
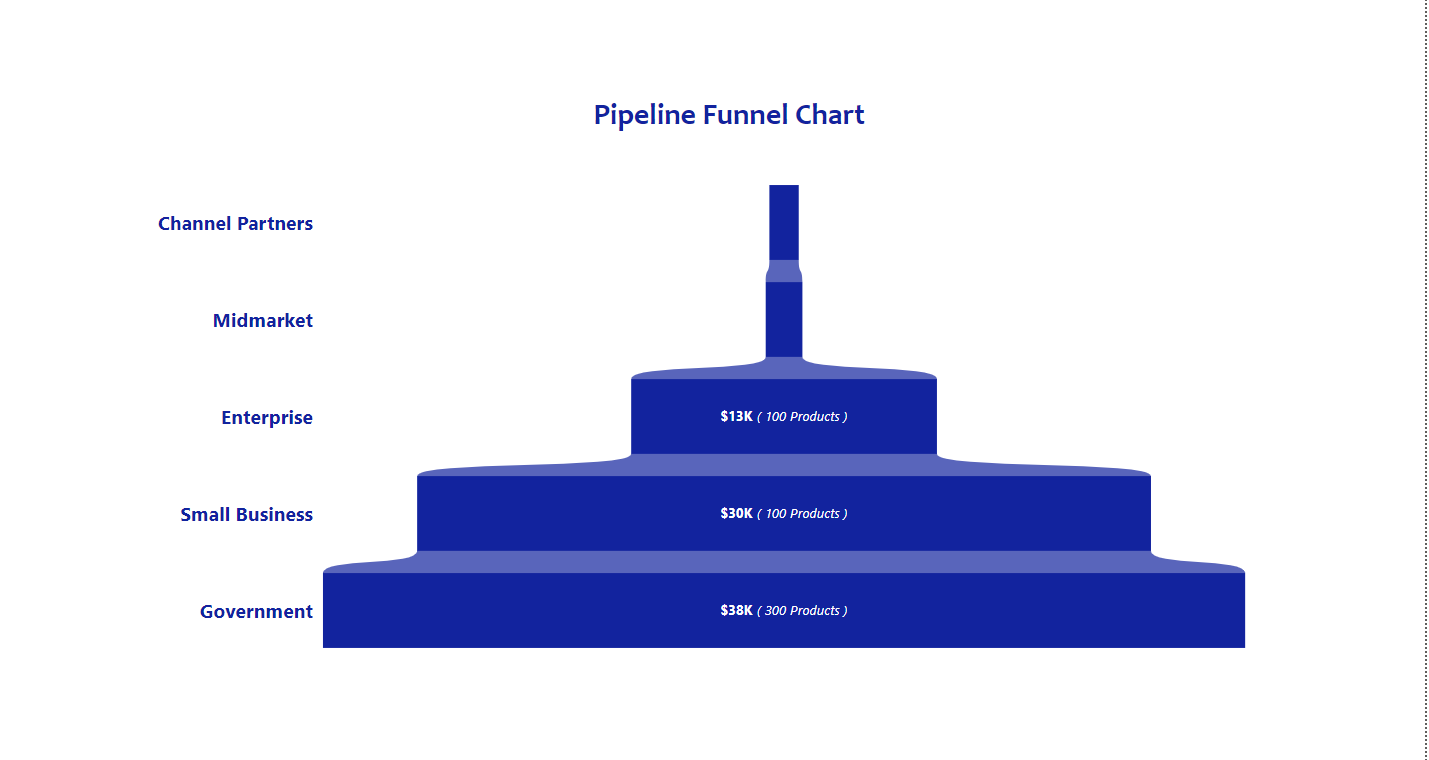
How to create a Pipeline Funnel Chart with Visual Calculation in Power BI
A Pipeline funnel chart demonstrates data flow through a linear, sequential process within a sales pipeline. They help readers quickly make sense of data and are often used by organizations to identify potential problems within a process. They also help organizations take quantified measurements of conversion, churn, and sales rates. – MindManagers . Funnel charts are usually seen in business.. Read more

Finding Fulfillment in Life
Every human has something that brings them a sense of fulfillment; knowing what makes you fulfilled is the beginning of a peaceful and purposeful life. One of the privileges I’m always grateful for is having discovered my source of fulfillment early on while growing up. In the book “The Element: How Finding Your Passion Changes Everything” by Sir Ken Robinson,.. Read more

Navigating Life’s Struggles
One of the most profound lessons life has taught me is survival. Life is truly a survival of the fittest. Irrespective of what you aspire to become, you will continuously find yourself fighting to win, keeping your head high against all odds by not giving up (na who give up fuck up; abi how dem dey talk am)